

What are Webhooks?

Imagine you're building an e-commerce platform and using an external payment processor like Stripe to collect payments from users.
Once a user completes a payment, your system needs to:
Mark the order as paid
Send an invoice
Notify the warehouse to start packing
But here's the challenge:
Stripe operates on its own infrastructure. Your system doesn’t control it. So how do you know instantly when a payment goes through?
A naive solution would be to keep asking Stripe every few seconds:
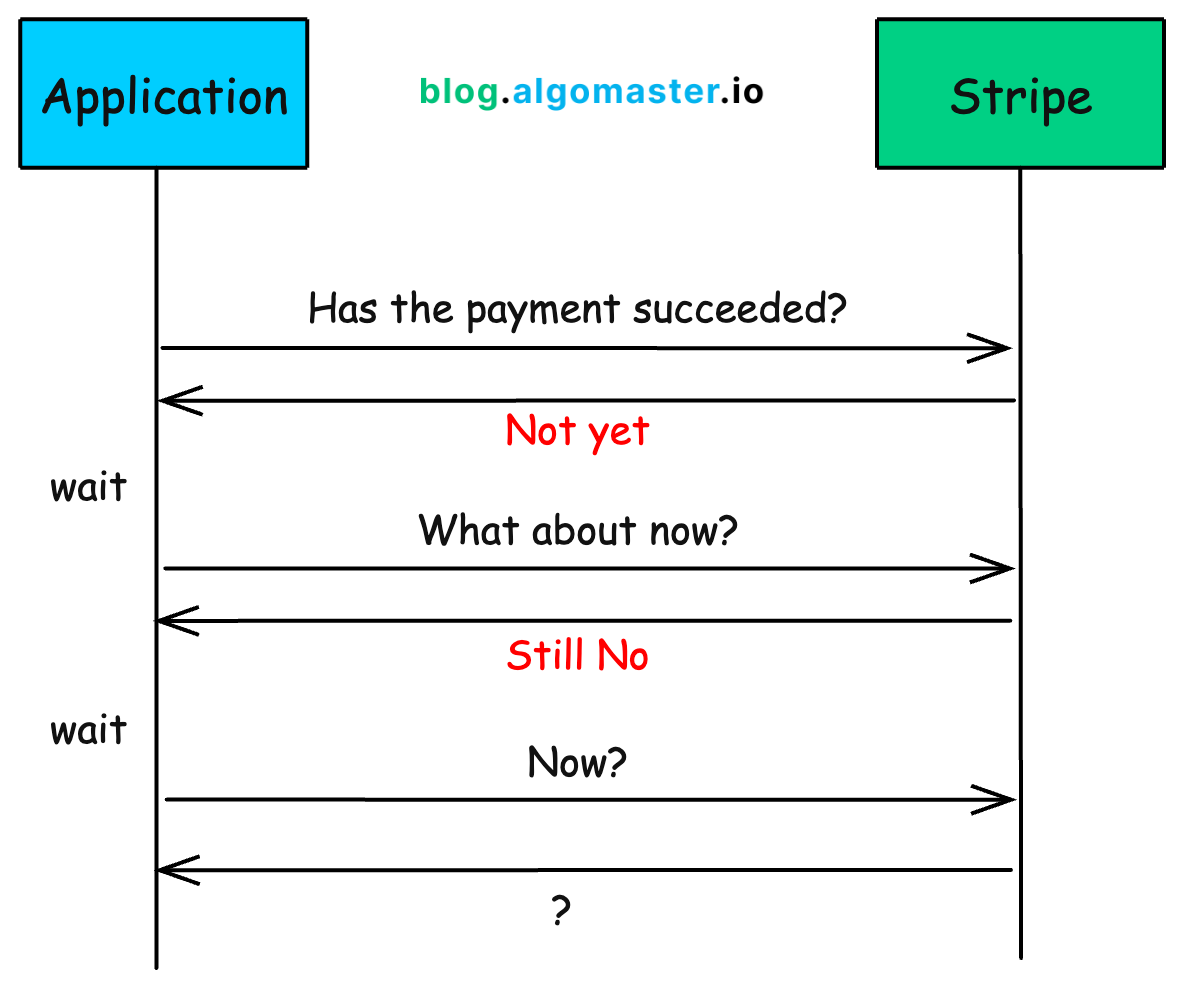
This is known as polling.
Now imagine doing this for every order on a site like Amazon.
It just doesn’t scale and wastes server resources.
Instead of your app repeatedly asking, what if Stripe could just tell you when the payment succeeds?
That’s what webhooks do.
In this article, we will explore:
What is a Webhook?
How Webhooks Work?
What does a Webhook request look like?
How to setup a Webhook receiver?
How to design a scalable Webhook infrastructure?
1. What is a Webhook?
A webhook is a simple way for one system (provider) to notify another system (receiver) in real time when an event happens using an HTTP request.

Instead of one system asking repeatedly if something happened, the other system simply pushes the data as soon as the event is triggered.
Real-World Analogy
Let’s say you go to a busy restaurant.
The host says: “There’s a 30-minute wait. Please leave your number, and we’ll text you when your table is ready.”
You don’t need to stand at the counter asking every 2 minutes: “Is my table ready yet?”
Instead, you walk away, and when your turn comes, they notify you automatically.
That’s the idea behind webhooks.
2. How Webhooks Work?
At a high level, webhooks work through registration, triggering, and delivery.
Let’s walk through a real example to see what actually happens under the hood.
Example: GitHub Webhook to Your App
Let’s say you’ve built a system that needs to react when someone opens a pull request (PR) in a GitHub repository — maybe to kick off a CI/CD pipeline, send a Slack notification, or run automated tests.
Here’s how the webhook flow works step-by-step:
Step 1: You Register a Webhook
You go to GitHub → Settings → Webhooks
You provide a webhook URL (e.g.,
https://myapp.com/github-webhook)You choose the events you care about, like
pull_request,push, orissue_comment
At this point, GitHub knows where to send data whenever those events occur.
Step 2: GitHub Monitors Events
GitHub monitors its internal event stream for your repository
When someone opens a new pull request, the event gets logged internally
Step 3: GitHub Sends a POST Request
GitHub prepares a JSON payload with details about the event: who opened the PR, which branch, repo metadata, etc.
It makes a
POSTrequest to your webhook URL:

Step 4: Your Server Processes the Event
Your app receives the request
You verify the signature (to ensure it really came from GitHub)
You process the payload — maybe enqueue it in a job queue, log it, or trigger business logic
You respond with an HTTP
200 OKto acknowledge receipt
3. Anatomy of a Webhook Request
To integrate with webhooks successfully, you need to understand what’s actually being sent to your server when the event occurs.
Most webhook providers use the HTTP POST method to send event data to your server.
Why POST? Because it allows the payload to be sent in the request body, which can include structured data (usually JSON) describing what happened.
Rarely, some services allow
GET,PUT, or evenPATCH, butPOSTis the de facto standard for webhook delivery.
Request Headers
The headers in a webhook request often include metadata and security-related information.
Common headers include:
Content-Type: Usually application/json (or sometimes application/x-www-form-urlencoded)
User-Agent: Identifies the sender (e.g., Stripe/1.0, GitHub-Hookshot)
X-Event-Type: Describes what type of event occurred (payment_intent.succeeded, pull_request, etc.)
X-Signature / X-Hub-Signature: A hash of the payload using a secret key (HMAC) used to verify the request authenticity
X-Request-ID: Unique ID for the webhook event (useful for logging/debugging)
Request Body
The body of a webhook request typically contains event data in JSON format. This data includes what happened, when it happened, and which user/resource it’s related to.
Example: GitHub PR Event
{
  "action": "opened",
  "number": 42,
  "pull_request": {
    "id": 11223344,
    "title": "Add login validation",
    "user": {
      "login": "octocat"
    },
    "created_at": "2025-04-21T12:00:00Z"
  },
  "repository": {
    "name": "awesome-project",
    "full_name": "octocat/awesome-project"
  },
  "sender": {
    "login": "octocat"
  }
}
Example: Stripe Payment Intent Succeeded
{
  "id": "evt_1PoJkD2eZvKYlo2CmOJbvwD9",
  "object": "event",
  "api_version": "2024-08-01",
  "created": 1713681701,
  "data": {
    "object": {
      "id": "pi_3JhdNe2eZvKYlo2C1IqojYg9",
      "object": "payment_intent",
      "amount": 2000,
      "currency": "usd",
      "status": "succeeded"
    }
  },
  "livemode": false,
  "type": "payment_intent.succeeded"
}
4. Setting up a Webhook Receiver
Once you’ve registered your webhook URL with a provider like GitHub or Stripe, the next step is to build a robust endpoint on your server that can receive and process these events reliably.
This sounds simple — just receive a POST request, right?
But in production, things get tricky:
Webhooks might arrive multiple times or out of order
Your server might be under load, or briefly unavailable
Malicious actors might try to spoof requests
Let’s break down how to setup your webhook receiver the right way.
4.1 Basic Setup
Create a Dedicated Endpoint
Start by exposing a simple HTTP endpoint like:
POST /webhookThis endpoint should:
Accept only POST requests
Accept only JSON (via
Content-Type)Be accessible over HTTPS
Make It Idempotent
Webhook events can be retried, duplicated, or even replayed by providers. Your handler must ensure that processing the same event multiple times has no side effects.
How?
Every webhook event includes a unique ID (e.g.,
evt_1234in Stripe,delivery_idin GitHub)Store a record of processed IDs in a database or cache
Before processing, check if the event ID has already been handled
if (eventAlreadyProcessed(eventId)) {
    return 200 OK;
}
This ensures exactly-once processing, even if you receive the same event more than once.
Handle HTTP Status Codes Properly
Return
200 OKafter successful handlingReturn
400 Bad Requestif the payload is invalid or malformedAvoid 5xx errors unless something truly failed because most providers retry on 5xx
4.2 Security Considerations
Webhooks are public endpoints. That means anyone on the internet can POST to them. You must validate incoming requests.
Verify the Signature (HMAC)
Most providers include a cryptographic signature of the payload, using a shared secret. This ensures the payload came from the real source.
Example (Stripe):
You configure a webhook secret:
whsec_abc123Stripe signs the payload using HMAC-SHA256
You verify the signature on your end:
String expectedSignature = hmacSha256(secret, payload);

if (!expectedSignature.equals(signatureFromHeader)) {
    return 403 Forbidden;
}
This prevents spoofed or forged webhooks.
Whitelist Source IPs (Optional)
Some providers publish static IP ranges from which webhooks are sent. You can optionally block all other IPs to tighten access.
Downside: This adds DevOps complexity and can break things if IPs change.
Don’t Expose Sensitive Data
Don’t log full webhook payloads in plaintext
Don’t return stack traces or internal errors in responses
Don’t include secrets or tokens in the response body
5. Designing a Scalable Webhook Infrastructure
As your application grows and starts receiving thousands or even millions of webhook events daily, a simple synchronous handler won’t be enough.
To make your webhook system reliable, fault-tolerant, and scalable, you need a design that’s asynchronous, decoupled, and observable.
Let’s walk through how to build a production-grade webhook processing pipeline.

5.1 Queue Incoming Requests
Don’t do heavy processing inside your webhook endpoint.
Instead:
Parse and validate the request
Verify its authenticity (signature, event ID, etc.)
Immediately enqueue the event into a message queue like:
Kafka (for high-throughput event pipelines)
RabbitMQ (lightweight and flexible)
AWS SQS (serverless and easy to manage)
This way, your server can return a fast
200 OK, while actual processing happens in the background.
5.2 Store Events for Audit & Replay
To ensure traceability and recovery, store every incoming event in a database:
Raw payload
Event ID and type
Source info (e.g., IP address, headers)
Status (
queued,processed,failed)Timestamps
Use a durable data store like PostgreSQL, MongoDB, or DynamoDB.
This gives you the ability to replay failed events and debug issues.
5.3 Process with Asynchronous Workers
Background workers (or worker pools) pull events from the queue and perform actual business logic:
Deduplicate the event using eventID
Run validations
Update internal databases or call downstream services
Trigger notifications or workflows
Why use workers?
You can scale them horizontally
You gain control over load and processing rate
You isolate failures from the webhook endpoint
5.4 Retry with Backoff
Sometimes, event processing fails temporarily due to a database issue, timeout, or an unavailable downstream API.
Your workers should retry those events automatically, using a backoff strategy:
Exponential (recommended): retry with increasing delays (1s, 2s, 4s…)
Linear: retry every N seconds (e.g., retry every 30s)
Jitter: add randomness to avoid all retries happening at once
Always limit retries and log failures after the final attempt.
5.5 Use a Dead Letter Queue (DLQ)
If a webhook consistently fails after multiple retries, don’t keep retrying forever.
Instead, send it to a Dead Letter Queue, a special holding queue for problematic events.
From there, you can:
Trigger alerts
Investigate the root cause
Retry manually after fixing the issue
This prevents bad events from clogging your pipeline and ensures no event is lost silently.
5.6 Add Observability: Logs, Metrics & Alerts
You can’t fix what you can’t see. Add observability at every stage of the pipeline.
Track metrics like:
Total webhook events received per hour
Success vs. failure rate
Processing latency
Queue length
Retry count and DLQ event count
Set alerts for:
Spikes in failure rate
Sudden drop in incoming events
Growing queue sizes (indicating backlog)
Popular observability tools:
Prometheus + Grafana (open-source)
Datadog, CloudWatch, New Relic (cloud-based)
ELK Stack (Elasticsearch + Logstash + Kibana)
With proper observability, you’ll catch issues early before they impact your users.
Thank you for reading!
If you found it valuable, hit a like ❤️ and consider subscribing for more such content every week.
P.S. If you’re enjoying this newsletter and want to get even more value, consider becoming a paid subscriber.
As a paid subscriber, you'll unlock all premium articles and gain full access to all premium courses on algomaster.io.
There are group discounts, gift options, and referral bonuses available.
Checkout my Youtube channel for more in-depth content.
Follow me on LinkedIn and X to stay updated.
Checkout my GitHub repositories for free interview preparation resources.
I hope you have a lovely day!
See you soon,
Ashish
Interesting & knowledgeable content.Thank you for sharing.
Very good! Thank u!